
Real-time Consultation Analytics
Live dashboards show consultation activity as responses arrive, with response tracking, demographic breakdowns and automated sentiment analysis in one place. Treat automated analysis as a review aid and check it against the underlying responses.
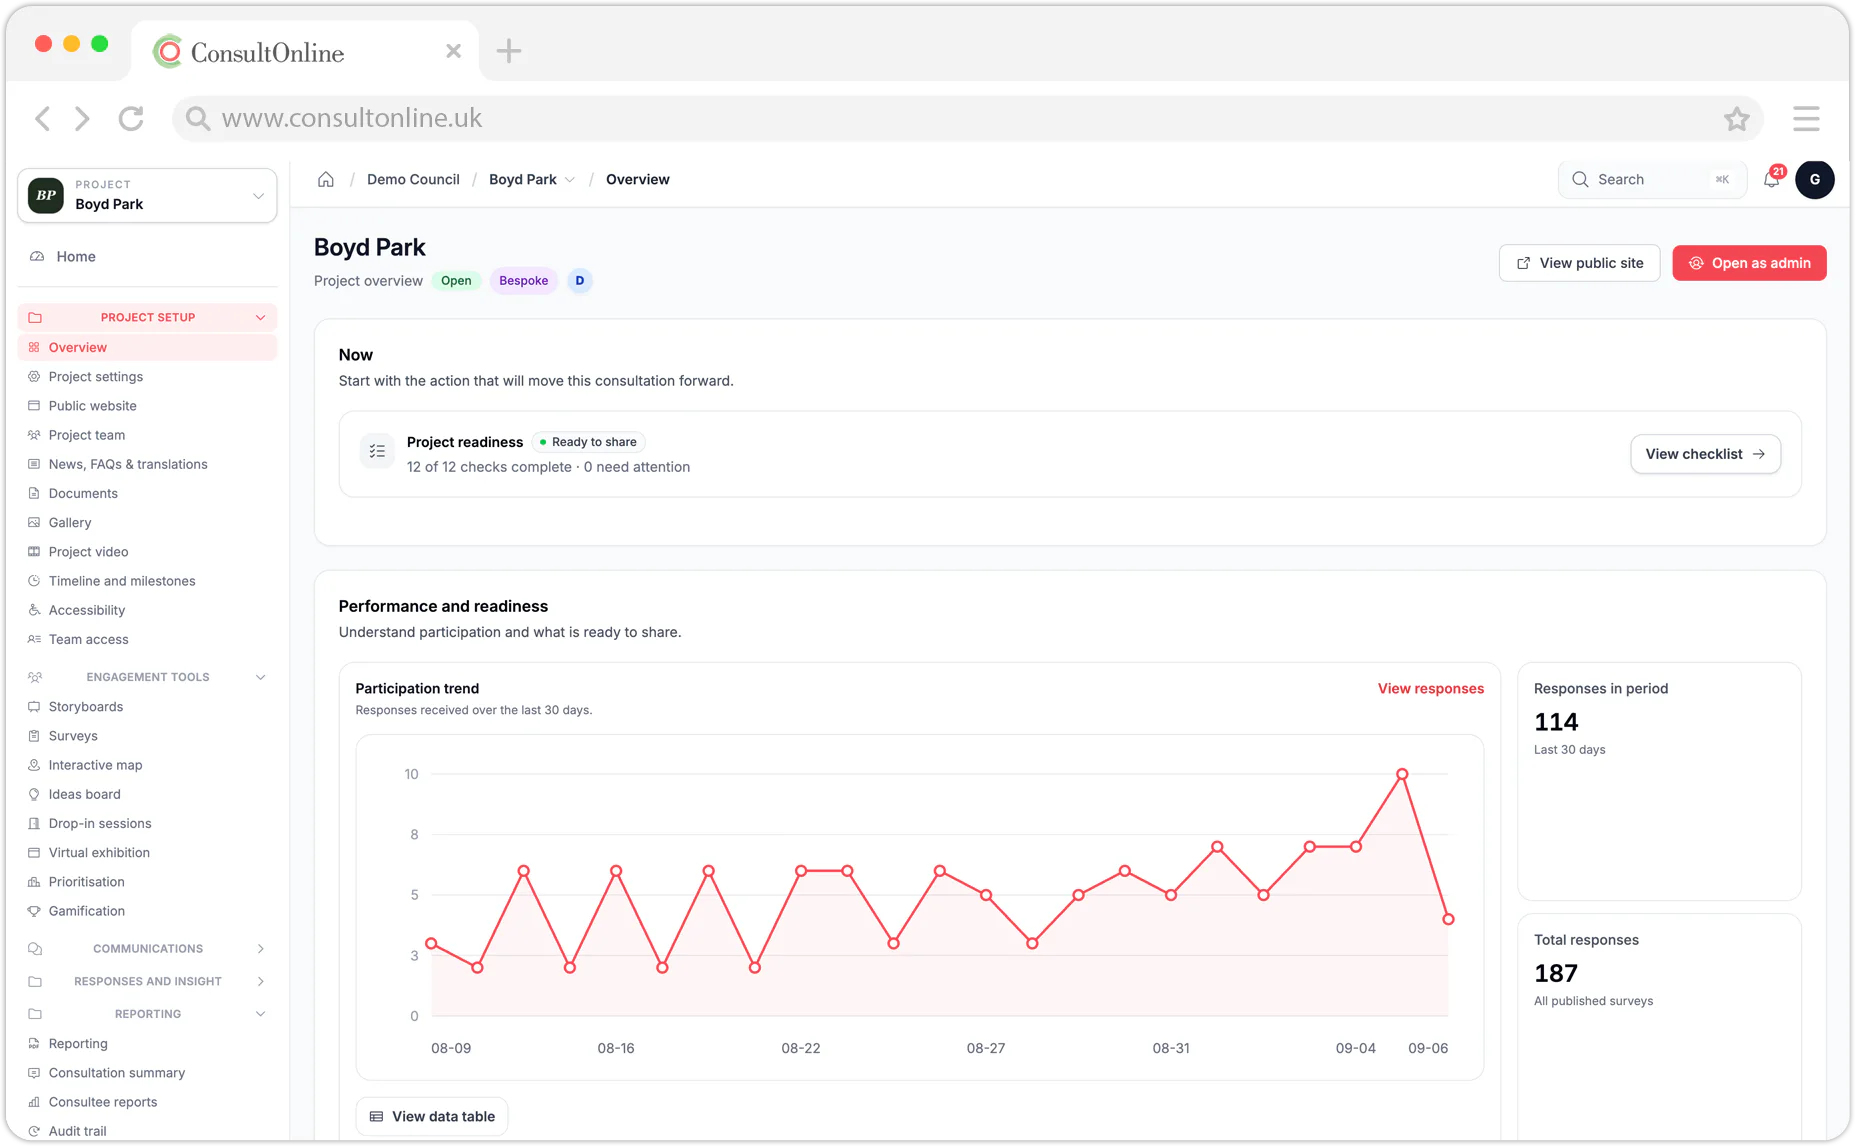
Live Dashboards
Interactive charts can update as recorded participation data is processed. Teams can review response rates, activity periods and progress against configured targets without running separate manual queries. Freshness and coverage depend on processing, tracking consent, configuration and source data.
Automated Sentiment Analysis
The platform automatically analyses the tone and meaning of free-text responses, scoring sentiment and extracting recurring themes. Understand whether community feedback is positive, negative or neutral at scale, without reading thousands of individual comments. Ideal for producing balanced summaries for planning consultation reporting.
Exportable Committee Reports
Generate draft PDF reports and CSV exports with available charts, summaries, sentiment analysis and data tables. Review source coverage, automated analysis, calculations, accessibility and formatting before using the output in committee papers, briefings or consultation documents.
The Problem with Traditional Approaches
Why real-time matters for public consultations
Consultation analysis can require substantial manual work: reviewing free-text responses, categorising themes, checking demographic information and preparing reports. The effort depends on the number, length and complexity of responses.
Structured response data and live dashboards reduce the need for spreadsheet collation and let teams begin reviewing patterns before a consultation closes.
With ConsultOnline, platform data appears in the dashboard as responses arrive. Automated sentiment and theme analysis can support review, while planning teams remain responsible for checking the source responses, interpreting context and approving conclusions.
How It Works
From data to decisions in three steps
Automatic Data Capture
Configured platform events and responses appear in the analytics dashboard without requiring a separate analytics service. Available tracking depends on the project settings and consent choices. Data-protection controls support compliant delivery, while your organisation remains responsible for its configuration, notices and lawful basis.
Intelligent Analysis
As responses are processed, the platform can create draft sentiment and theme analysis and aggregate quantitative answers. Geographic and demographic breakdowns depend on the information respondents supplied and the configured mappings. Automated outputs may be incomplete or wrong and require review against source responses.
Report Drafts for Review
Download polished reports with charts, executive summaries and detailed data tables at any point during or after your consultation. Reports are formatted for planning committee papers, consultation reports documents and stakeholder briefings. Export raw data as CSV for further analysis in your own tools or share live dashboard links with colleagues and councillors who need to stay informed.
Purpose-Built
Analytics built for planning professionals
Generic analytics tools were not designed for the specific requirements of planning consultations. ConsultOnline provides the metrics and reports that developers, consultants and local authorities actually need.
Track Consultation Participation Rates
Monitor how many residents are engaging with your consultation in real time. Set participation targets based on population data and track progress against them. Identify whether engagement is growing, plateauing or declining so you can adjust your promotion strategy mid-consultation rather than discovering low turnout after it is too late.
Consultation Report Evidence
Demographic analysis tools help you demonstrate that your consultation has reached a representative cross-section of the community. Monitor response demographics against local census data to identify underrepresented groups early, giving you time to run targeted outreach before the consultation period ends. Generate the demographic evidence needed for your consultation report.
Geographic Clusters of Feedback
Visualise where responses are coming from with postcode-level geographic analysis. Identify clusters of support or opposition, spot areas with low engagement that may need additional outreach and understand how proximity to a proposed development affects sentiment. Geographic data is presented on interactive maps and can be broken down by ward or parish.
Compare Engagement Across Phases
For multi-stage consultations such as Local Plan reviews or phased development proposals, compare engagement metrics across different consultation phases. Understand how participation, sentiment and key concerns evolve from early engagement through to formal consultation. Track whether issues raised in earlier phases have been addressed in community perception.
Benchmark Against Previous Consultations
Compare current consultation performance against your historical data. See whether your engagement rates are improving over time, whether new outreach strategies are working and how sentiment on recurring planning themes has shifted. Benchmarking data helps you demonstrate continuous improvement in your consultation practice to inspectors and auditors.
Real-time Alerts and Notifications
Set up alerts for key milestones such as reaching participation targets, sudden spikes in negative sentiment or when responses from a particular area exceed a threshold. Stay informed without constantly checking the dashboard, and respond quickly to emerging trends that might require adjustments to your consultation approach or communications.
See your consultation data come to life
Book a demo and we will walk you through the analytics dashboard using real consultation data. See exactly how response tracking, sentiment analysis and reporting work in practice.
Capabilities
Comprehensive consultation analytics at your fingertips
Tools for reviewing recorded engagement data, producing draft analysis and assembling report content in one dashboard. External and offline data may need separate reconciliation.
Sentiment Analysis
Understanding sentiment at scale
Free-text responses can contain nuanced views that require careful interpretation. Large consultations may contain many written comments covering different planning topics.
ConsultOnline can apply automated sentiment and theme analysis as responses arrive, grouping related material and presenting provisional patterns in charts and summaries. Automated classifications can be wrong or miss context, so teams should review them against the original responses.
These tools can reduce manual collation and help teams prepare draft analysis. Final reports, figures and conclusions should be checked and approved by the responsible consultation professionals.
Metrics That Matter
Data you can act on
Dashboard metrics can support reporting and review, but depend on source coverage, configuration and interpretation and do not guarantee better decisions.
Response Rate Tracking
Monitor the total number of responses, completion rates for each survey section and drop-off points where respondents abandon the process. Set participation targets and track progress in real time so you can boost promotion efforts if engagement falls below expectations.
Geographic Analysis
Map responses by postcode, ward or parish to understand the geographic distribution of feedback. Identify areas of concentrated support or opposition and spot gaps in engagement that may need targeted outreach. Essential for demonstrating geographic reach in your consultation report.
Demographic Breakdowns
Understand who is responding to your consultation with breakdowns by age, gender, ethnicity, disability status and other characteristics. Compare your respondent profile against local census data to assess how representative your consultation has been and identify groups that may need additional engagement.
Sentiment Scoring
Where automated analysis is enabled, included free-text responses can receive provisional sentiment and theme labels. These outputs can be wrong or miss context and do not establish overall community opinion; review them against the source responses before use.
Device & Accessibility Metrics
Track available device, browser and screen-size data to help prioritise testing. This data does not identify every assistive technology or establish accessibility compliance; representative manual testing is still required.
Response Timeline Analysis
Visualise when responses are submitted with hourly, daily and weekly trend charts. Identify the impact of promotional activities, press coverage or social media posts on response volumes. Understand peak engagement times so you can schedule communications and social media posts for maximum impact on future consultations.
FAQ
Frequently asked questions
Ready for smarter consultation insights?
Use live dashboards and automated analysis to explore patterns, sentiment and demographic information in your consultation data. Review the underlying responses before drawing conclusions.
More features to discover