
Interactive Consultation Maps
Collect location-linked feedback with pin-drop maps. A selected point can add spatial context to a comment, but map usability and accessibility depend on the device, content and configuration and interpretation still requires human review and alternative response routes.
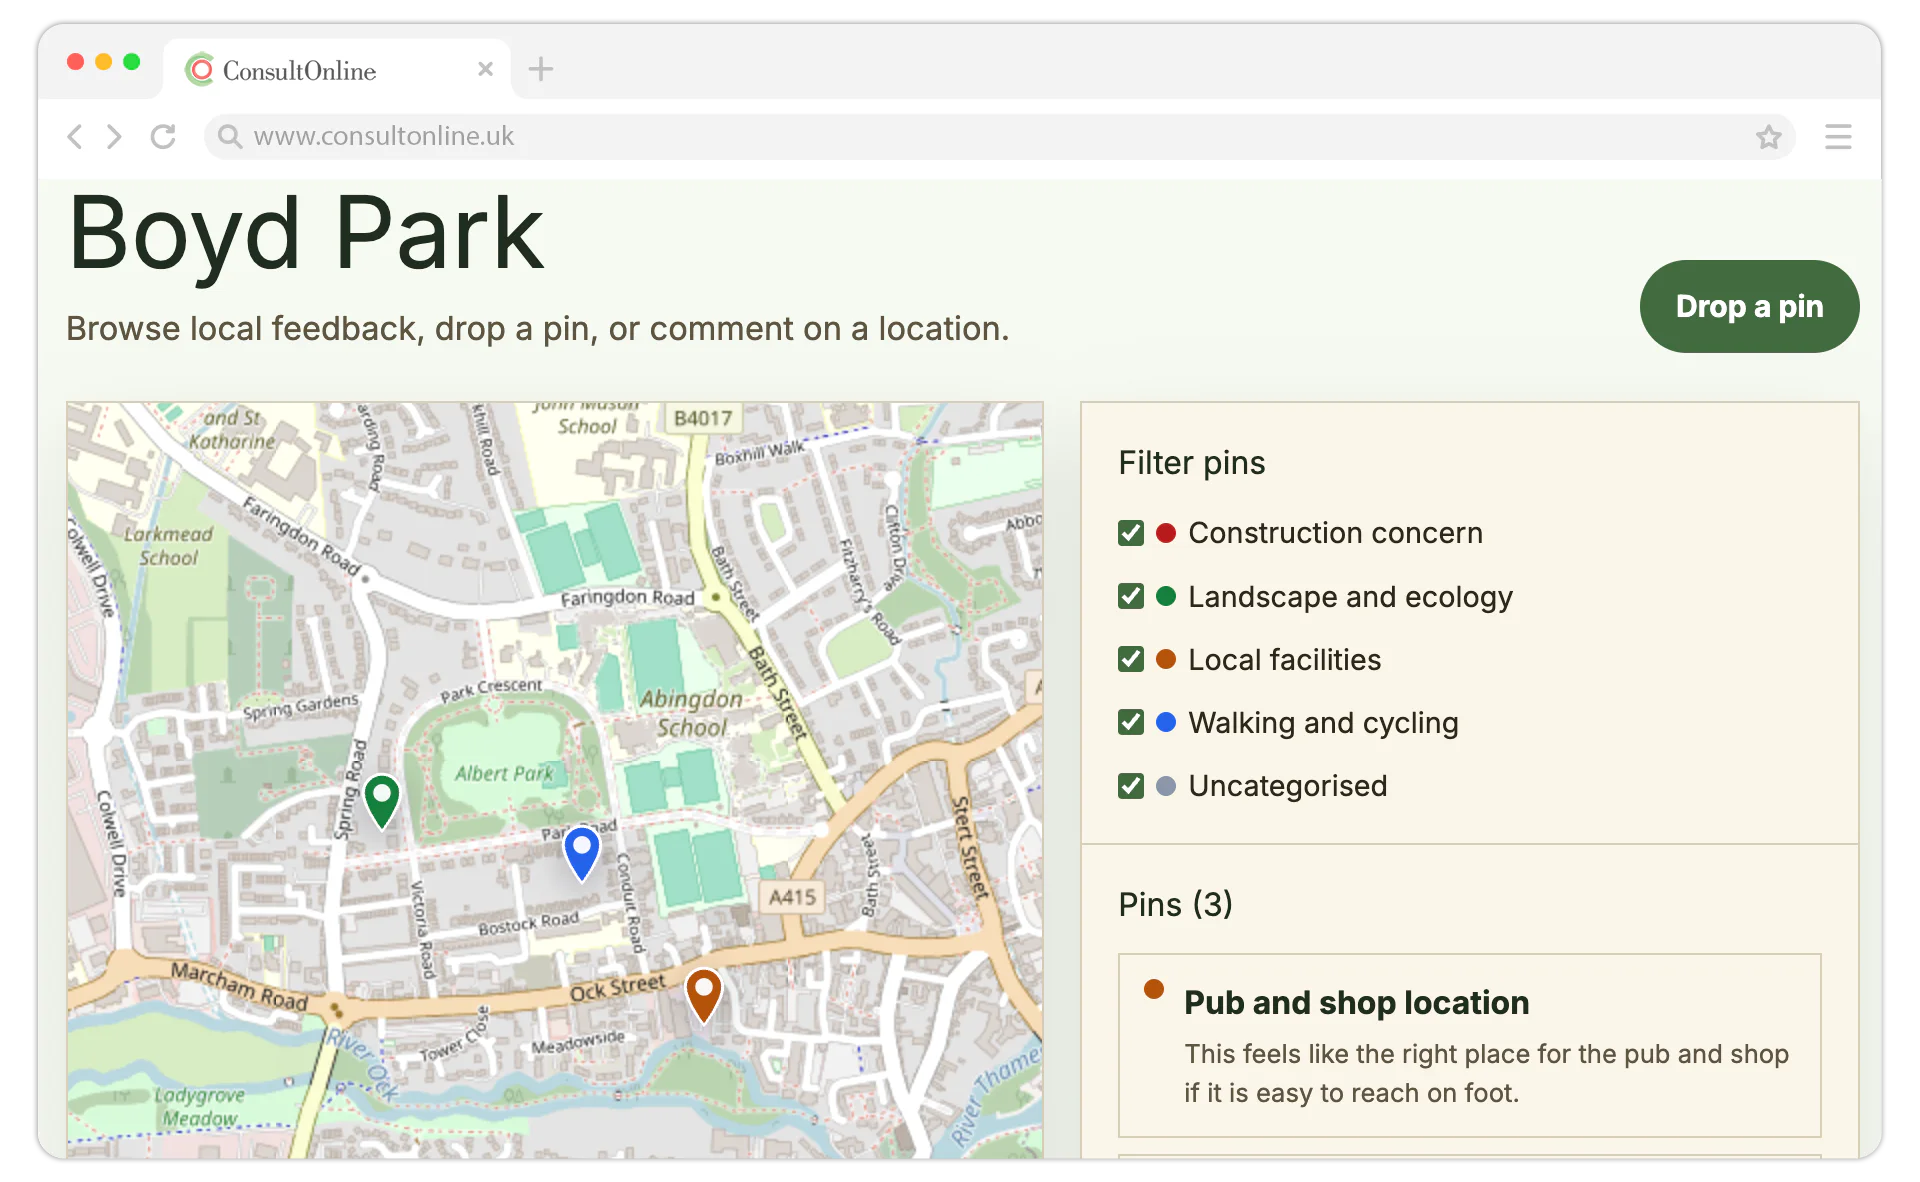
Pin-Drop Feedback
Residents can select a location on the consultation map, drop a pin and add a comment without entering a grid reference. Provide an alternative response route for people who cannot use an interactive map.
Category Filtering
Organise pins by category — traffic, green space, housing, noise, heritage, accessibility and more. Filter the map to isolate specific concerns and build a clear picture of community priorities by theme and location.
Comment Threads
Each pin becomes a discussion point. Other residents can upvote, reply and add context to existing pins on the map — building a rich, threaded conversation tied to a real-world location on the planning application map.
The Spatial Advantage
Why location-based feedback changes consultation
Written submissions can make it difficult to tell exactly where a comment relates to. Location-based feedback lets a resident associate a comment with a selected point on the map, giving the consultation team additional spatial context.
A map can offer a familiar alternative to a blank text box and may lower the effort required to provide location-specific feedback. Participation effects vary by audience, promotion, map design and the availability of accessible alternatives.
As responses accumulate, clusters, category filters and heatmaps can help teams explore spatial patterns. These views support analysis but should be interpreted alongside the underlying comments and the wider consultation evidence.
How It Works
From boundaries to heatmaps in three steps
Set Your Boundaries
Draw the consultation boundary directly on the map using our boundary drawing tools. Define the geographic area residents can place pins within — whether that is a single development site, a neighbourhood plan area or an entire town centre. Configure your pin categories, choose colour coding and set moderation preferences before you publish.
Residents Drop Pins
Community members visit your consultation microsite, navigate the interactive map and drop pins at specific locations. They select a category for their feedback, write their comment and can upload supporting photos. Other residents can view existing pins, upvote comments they agree with and add replies to build threaded discussions around each location.
Analyse & Export
See feedback density with heatmap overlays that reveal spatial patterns at a glance. Filter by category to isolate specific themes. Identify hotspots of concern, export spatial data as GeoJSON or CSV for your reports and GIS software and use the insights to produce evidence-based planning recommendations.
See interactive maps in action
Book a short demo and we will walk you through setting up a pin-drop consultation map for your next project — from boundary drawing to heatmap export.
Capabilities
Powerful spatial feedback tools
Everything you need to run effective location-based consultations, from map setup and moderation to analysis and data export.
Analysis & Reporting
From individual pins to spatial insights
Map pins can be aggregated into density layers to show where recorded feedback is concentrated. These patterns describe the responses received and should not be treated as representative of the wider population without further analysis.
Category filters let teams view recorded pins by topics such as traffic, noise, green space, heritage or a custom category. This can support thematic review alongside the original comments.
Pin data can be exported as GeoJSON or CSV for further analysis. Available fields depend on the data collected and export settings, so review the export before using it in planning statements, committee reports or public summaries.
Feature Deep Dive
Map features in detail
A closer look at the tools available for gathering and reviewing spatial planning feedback.
Pin-Drop Comments
The core of location-based consultation. Residents tap or click any point on the map to place a pin, then write their comment in a simple pop-up form. Each pin records precise coordinates, a timestamp, the selected category and the full comment text. Pins can also include photo attachments, giving residents a way to show as well as tell.
Category & Colour Coding
Define custom categories for your consultation — traffic, noise, green space, heritage, accessibility, housing or anything relevant to your project. Each category gets a distinct colour, so the map is immediately readable at a glance. Residents select a category when they drop a pin, and planners can filter the map to show only the categories they need.
Heatmap Visualisation
Switch from individual pins to a heatmap of recorded feedback density in the selected area. Heatmaps may help identify clusters for further review, but they do not establish prevalence or representativeness. Check colour use, accessibility, source coverage and interpretation before including them in reports or presentations.
Boundary Drawing
Define the geographic scope of your consultation by drawing boundaries directly on the map. Residents can only place pins within the defined area, keeping feedback focused and relevant. Boundaries can follow site red lines, neighbourhood plan areas, parish boundaries or any custom shape you need. Adjust boundaries at any time during the consultation.
Mobile Touch Gestures
Interactive maps support common touch gestures and responsive layouts on supported mobile devices. Screen size, browser and input method affect the experience, so test representative devices and provide an alternative response route.
Data Export & GIS Integration
Export available map data in GeoJSON or CSV for use in compatible analysis tools. Included coordinates, categories, comments, timestamps and vote fields depend on the selected scope, permissions and source records. Validate format compatibility and completeness before reporting or further analysis.
FAQ
Frequently asked questions
Ready to map your community's feedback?
Collect location-linked feedback and review where recorded comments cluster across the selected consultation area. Usability, participation and enjoyment vary by audience, device, connection and consultation design.
More features to discover